|
Reports The Reports view is a web based view of the reports defined in the plot document. The Reports view will also display the QuickLook preview saved with the plot and these online help files. Reports are selected by tapping the icon in the upper left corner of the screen. 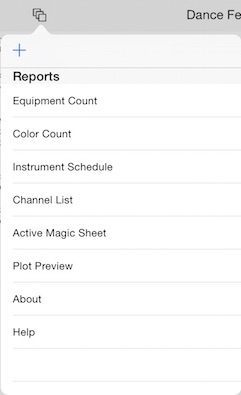
The popover shows the reports that are saved as part of the XML plot file. However, you can add basic reports from the library of report templates by tapping the 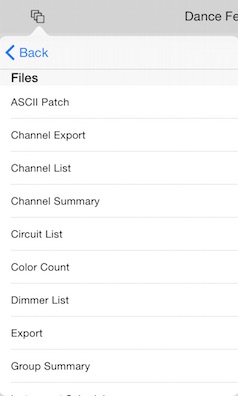
You can e-mail or print reports by tapping the action icon in the upper right corner. 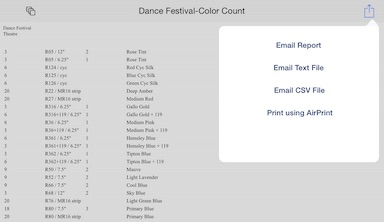
Reports are displayed in HTML format. This is how a channel summary report looks: 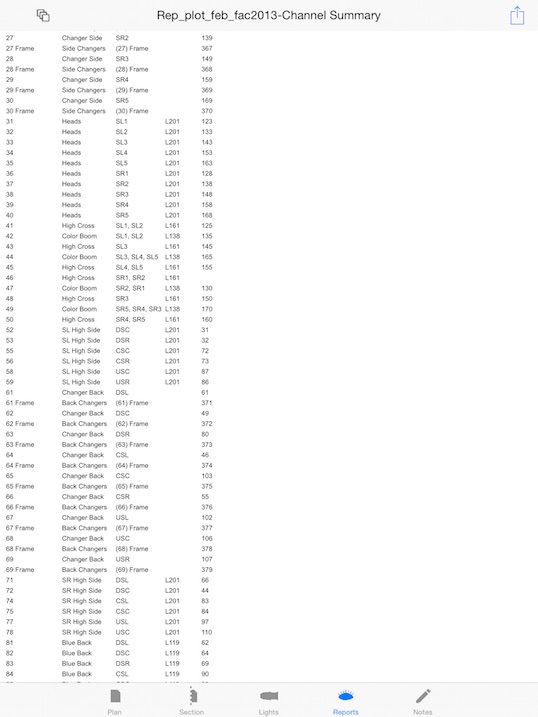
This is how a group summary report looks: 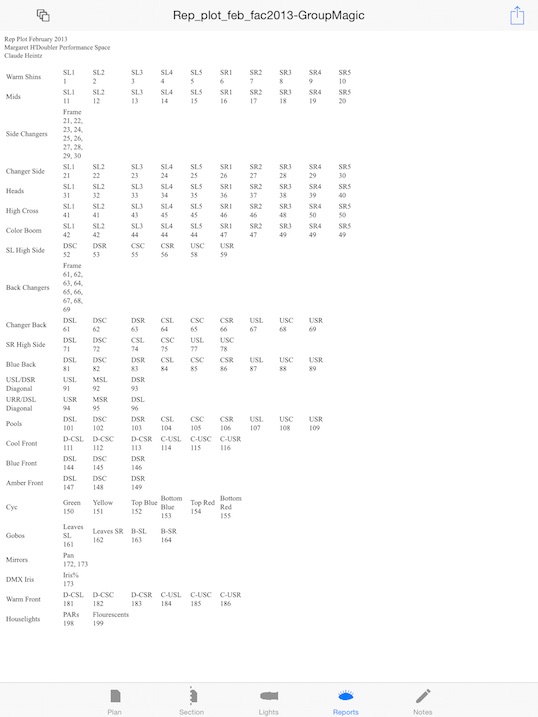
|
 icon in the upper left corner of the reports popover.